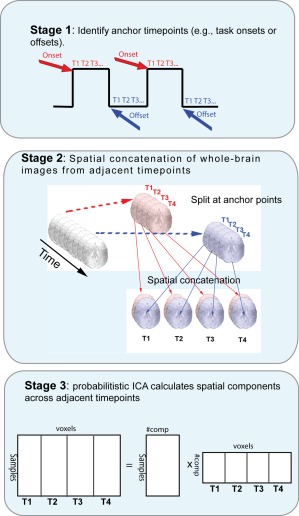
Figure 1.

Transition spatiotemporal independent component analysis (transition stICA). Schematic showing high‐level description of the approach. Anchor points of theoretical interest are defined, such as marking the time‐point at the start or end of task blocks. The subsequent N volumes following each anchor point (in this example, four) are then rearranged and spatially concatenated along the lateral/medial dimension (although the choice of spatial dimension is arbitrary). The four‐volume wide spatial map for each anchor point is then concatenated in the fourth dimensions (i.e., what is normally thought of as the temporal dimension), and the data is then entered into an ICA. [Color figure can be viewed in the online issue, which is available at http://wileyonlinelibrary.com.]
