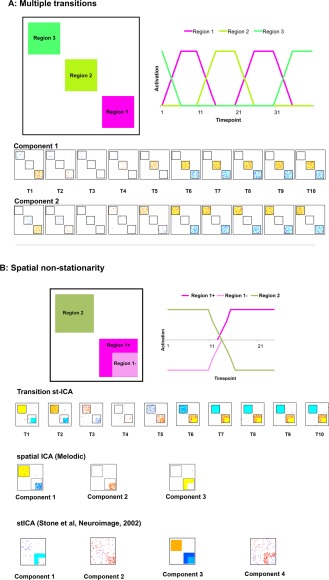
Figure 2.

Simulated FMRI data, method and results of spatiotemporal independent component analysis (stICA). Two examples of simple synthetic data illustrating two different examples that the transition stICA approach can detect. (A) Two symmetric transitions where Region 1 precedes either Regions 2 or 3 with equal frequency, or Regions 2 or 3 precede Region 1. Top left is an illustration of the spatial patterns used to generate the synthetic data. Top right is an illustration of the timecourses used, with the spatial patterns, to create transitions. Below are the components found from the stICA. (B) A second simulation, illustrating a case of spatial nonstationarity. Regions 1 and 2 are anticorrelated, but Region 1 is a different size when it is deactivated than when it is activated. At the bottom of 2B we see: first, the transition stICA that captures the spatial nonstationarity; followed by two additional ICA approaches: an example of a standard spatial ICA and an alternative stICA [Stone et al., 2002] both of which fail to capture the spatial nonstationarity and anticorrelated network structure. Voxels are displayed at z‐values where the probability of a voxel being part of the component rather than noise was >0.95. To aid visualization, square black boxes have been placed around the distinct regions in the ICA output. [Color figure can be viewed in the online issue, which is available at http://wileyonlinelibrary.com.]
