
Figure 3.
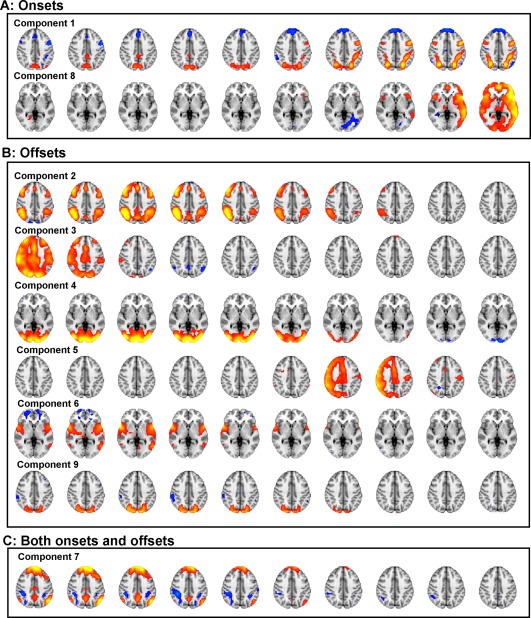
Nine spatiotemporal components extracted from a 30‐component spatiotemporal independent component analysis (stICA). Time is presented from left to right, different columns representing the 10 time‐points following an anchor point. Cool colors represent voxels negatively coupled to the component and warm colors positively coupled. All components were classified according to whether they were significantly (Bonferroni‐corrected for multiple comparisons) more activated for task onset anchor points, (A) or offsets (B), or neither (C). [Color figure can be viewed in the online issue, which is available at http://wileyonlinelibrary.com.]