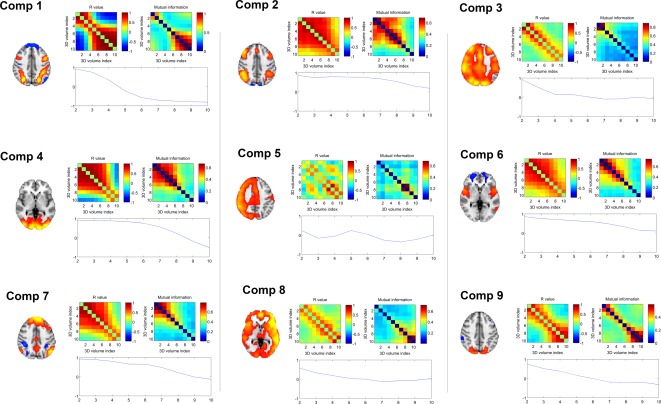
Figure 4.

Assessing spatial change over time within spatiotemporal components. For each component, the similarity matrix (calculated using spatial correlation and mutual information) between each time‐point is presented. In addition, the spatial correlation between the first time‐point and each additional time‐point is also presented. Brain images shown are a representative time‐point from within each spatiotemporal component. Full components are shown in Figure 3 and Supporting Information. [Color figure can be viewed in the online issue, which is available at http://wileyonlinelibrary.com.]
