
Figure 7.
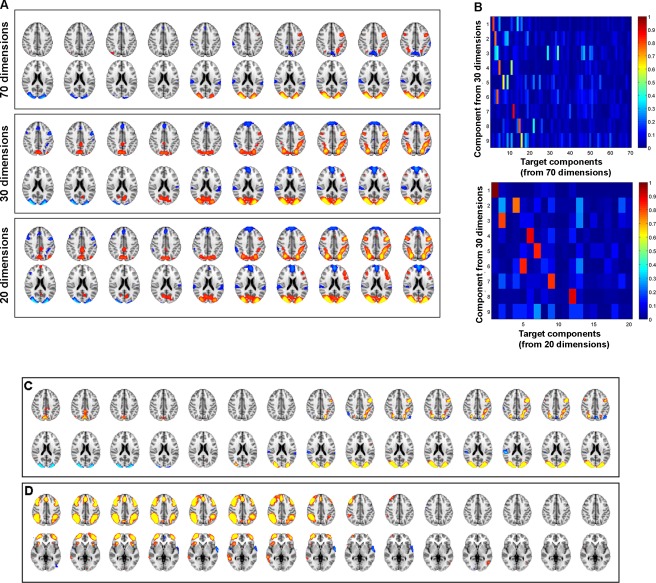
Demonstrating the robustness of the findings with different analyses. (A) The homologue of Component 1 from the 30‐component transition stICA (middle row) in both a 20‐ (bottom) and a 70‐component (top) analysis. (B) Matrix of spatial correlation between each of the nine non‐noise components from the 30‐component transition stICA and components from either the 20‐ (top matrix) or 70‐dimension analyses (bottom) coefficients. Absolute correlation coefficient values are plotted, since the sign of the correlation between components is not important for assessing spatial similarity. This shows strong, unique correlations between most of the nine components and homologues in the 20‐ and 70‐dimension analyses. (C and D) Exploring the results when spatially concatenating 15 rather than 10 time‐points, using a 30‐dimensional transition stICA. Time is from left to right. (C) The homologue of Component 1 (see Fig. 3A for comparison), (D) the homologue of Component 2 (see Fig. 3B). [Color figure can be viewed in the online issue, which is available at http://wileyonlinelibrary.com.]