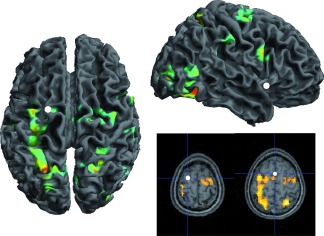
Figure 6.

Network of regions parametrically modulated by writing duration, for both letters and digits. The statistical values and position of the activations can be found in Supporting Information Table 2. The white patches indicate the position of the three regions evidenced in the Letters vs. Digits parameter contrast. [Color figure can be viewed in the online issue, which is available at http://wileyonlinelibrary.com.]
