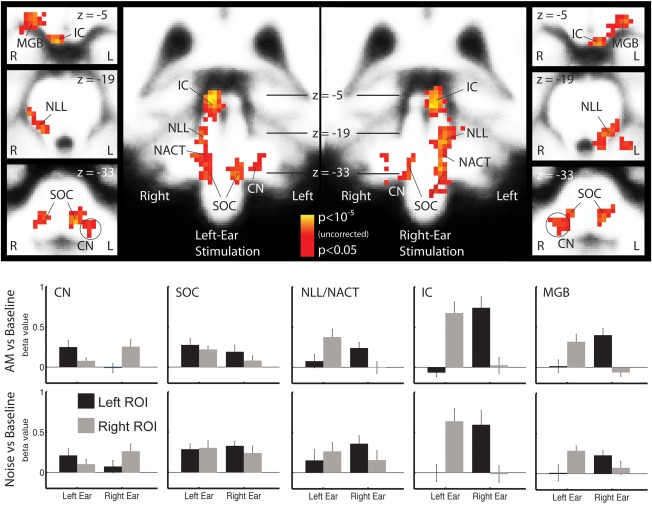
Figure 1.

Brainstem activity maps and ROI analysis. The maps in the upper half of the figure show the sound‐versus‐silence contrast in the group analysis separately for left‐ and right‐ear stimulation in the left and right half of the figure. The group analysis is corrected for multiple comparisons at the cluster level. Note that the scaling on the voxel level is not corrected for multiple comparison. The ROI analysis shown in the lower half of the figure shows the average activity across listeners (mean ± standard error) for the regions defined in the average brain and using only voxels active in the group analysis. The activation pattern was very similar for UN‐versus‐baseline (lower panels) and AM noise‐versus‐baseline (upper panels). There was no significant difference in subcortical nuclei between AM and UN in the ROI analysis or in the voxel‐wise group analysis (not shown).
