Figure 3.

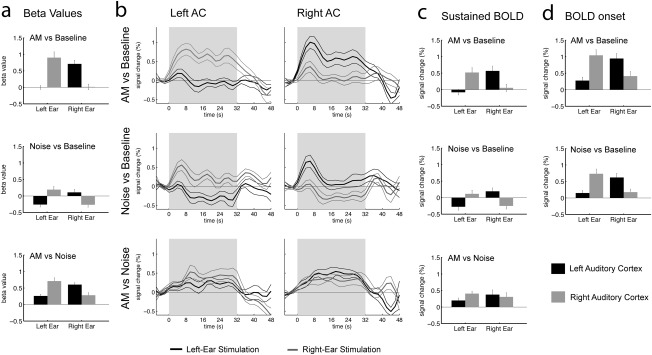
ROI analysis of BOLD activity in AC. The analysis is based on the contralateral activity in the sound‐versus‐baseline contrast (Fig. 2d). All graphs show the mean and standard errors across subjects (N = 12). Activity in the left AC is plotted in black, activity in the right AC is plotted in gray. The first line in all columns shows the data for the AM‐versus‐Baseline contrast, the second line the Noise‐versus‐Baseline contrast, and the third line the AM‐versus‐Noise contrast. (a) Activity estimated by the regression model used to generate the maps in Figure 2. This analysis is equivalent to the subcortical ROI analysis in Figure 1. (b) Reconstructed BOLD waveforms for all conditions for the left and right AC ROI. Activity for left‐ear stimulation is plotted in black, activity for right‐ear stimulation is plotted in gray. These time courses were used to selectively measure (c) average sustained BOLD amplitudes in the time range 14–34 s after sound onset, as well as (d) peak amplitudes for the onset transient in the time range 2–14 s after sound onset.
