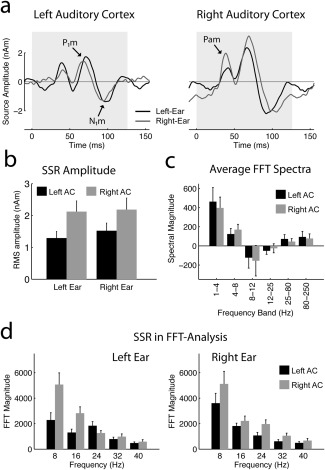
Figure 4.

Summary of MEG data. (a) Auditory SSR evoked by the 8‐Hz AM in the left and right AC. The data were averaged across all cycles of the 32‐s long stimuli. The peaks Pam, P1m, and N1m are observed in both hemispheres. (b) RMS amplitudes (mean ± standard error; N = 11) of the steady‐state source waveforms. (c) FFT spectra averaged disregarding phase information after subtraction of the baseline activity obtained in silent epochs. The panel shows the sum of all four stimulus conditions (AM and UM, left and right ear), because no significant differences were found between these conditions. No significant ear‐dependent lateralization was observed in particular. (d) FFT analysis of the SSR for the F0 (8 Hz) and four harmonics at 16, 24, 32, and 40 Hz. The left panel shows the result for left‐ear and the right panel for right‐ear stimulation. Activity in the left AC is plotted in black, activity in the right AC is plotted in gray.
