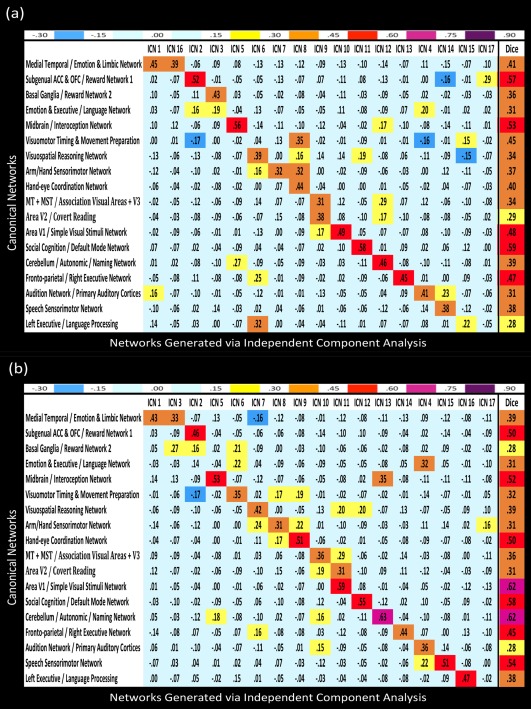
Figure 2.

Spearman rank‐order correlations and Dice similarity correlations were calculated between the network masks from the BrainMap database and the ICN spatial maps generated from the ICA of functional data from (a) the HI task and (b) the VG task. ICA networks were assessed for having at least a modest score on the Dice similarity index (s ≥ 0.4) with a corresponding BrainMap network. In addition, the Spearman correlations were found to be significant above a threshold of (r ≥ 0.433) at α < 0.05. [Color figure can be viewed in the online issue, which is available at http://wileyonlinelibrary.com.]
