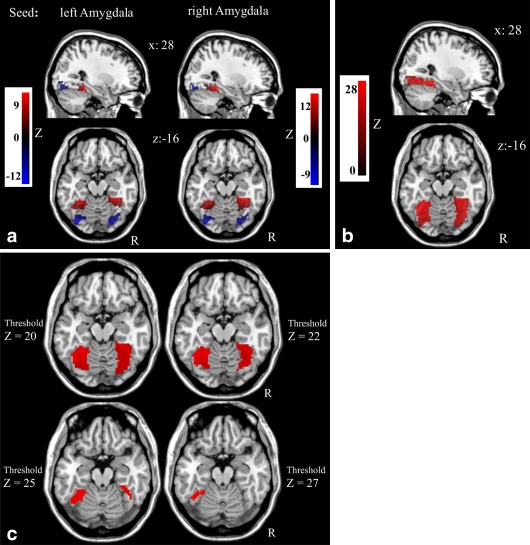
Figure 1.

(a) Polarity dependent distinct amydala rs‐FC distribution within the fusiform gyrus (i.e., anterior vs. posterior clusters according to rs‐FC polarity with global signal regression). All P‐cluster level ≤ 0.01 FWE small‐volume corrected with bilateral fusiform gyrus mask; Table 2. Red: positive rs‐FC; Blue: negative rs‐FC. (b) Results of the amygdala rs‐FC analysis without removal of the global mean signal in the entire sample (rs‐FC overlays of left and right amydala). (c) Thresholding of the results of the amygdala rs‐FC analysis without removal of the global mean signal in the entire sample (rs‐FC overlays of left and right amydala) does not emerge in anterior–posterior distributed clusters. [Color figure can be viewed in the online issue, which is available at http://wileyonlinelibrary.com.]
