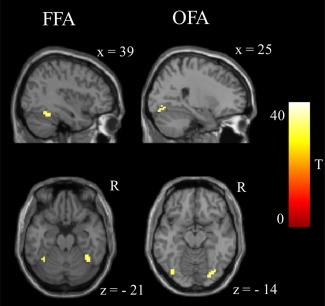
Figure 2.

Face sensitive areas within the fusiform gyrus that were identified by thresholding (T ≥ 34) of task‐evoked activity. All P‐cluster level ≤ 0.01 FWE small‐volume corrected with bilateral fusiform gyrus mask; Table 3). FFA: fusiform face area; OFA: occipital face area. [Color figure can be viewed in the online issue, which is available at http://wileyonlinelibrary.com.]
