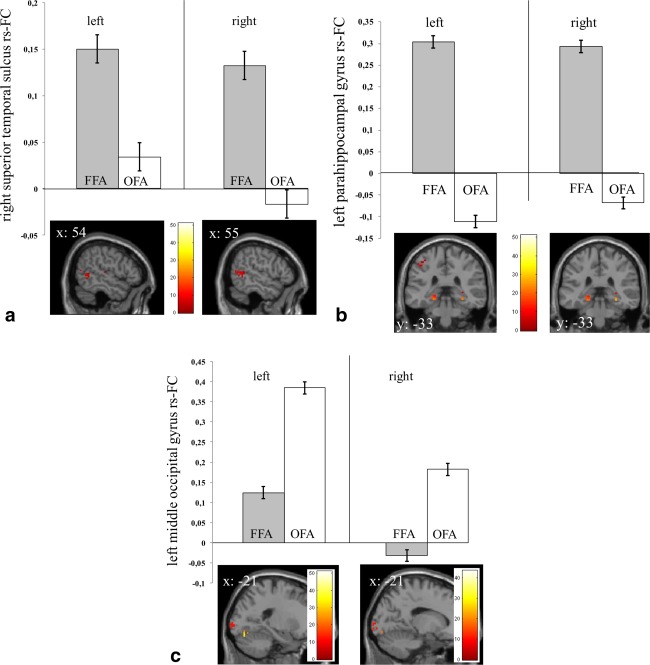
Figure 5.

(a–c) Differential resting‐state connectivity pattern of amygdala seed rs‐FC defined FFG clusters (i.e., FFA and OFA) to (a) the right superior temporal sulcus, (b) the left parahippocampal gyrus, (c) the left middle occipital gyrus as revealed by paired sample‐t‐tests per hemisphere (left/right: extractions of rs‐FC for peak voxel according to Table 6 with 3‐mm sphere). All P‐peak voxel ≤ 0.05 FWE small‐volume corrected with a mask (1669 voxels) defined by the http://Neurosynth.org reverse inference tool with keyword “face”). [Color figure can be viewed in the online issue, which is available at http://wileyonlinelibrary.com.]
