
Figure 5.
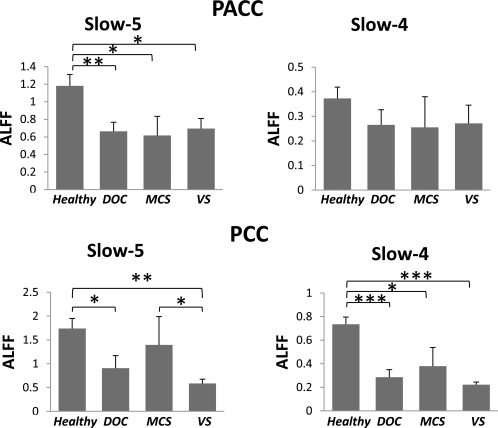
Comparison of the mean ALFFs in the resting state between healthy and patient groups. ALFFs (mean ± S.E.) in the healthy group (n = 12), DOC group (n = 10), MCS subgroup (n = 4), and VS/UWS subgroup (n = 6) were compared. *P < 0.05, **P < 0.01, and ***P < 0.001.