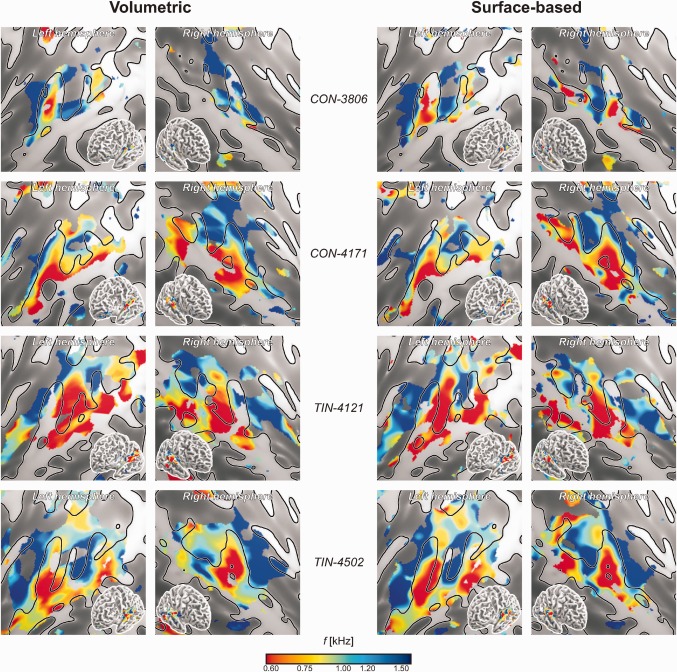
Figure 3.

Individual tonotopic maps depicting the spatial distribution of frequency indices f (converted to kHz) in four individual subjects according to the volumetric (left) and surface‐based (right) analyses. The top two subjects belonged to the control group (CON); the bottom two are tinnitus patients (TIN). Supporting Information Figures 1 and 2 show similar maps for all 40 subjects according to the volumetric and surface‐based analyses, respectively. Results from all vertices that showed significant sound‐evoked responses (P < 0.05, uncorrected) are colour‐mapped on flattened cortical representations, showing the individual gyral morphology (light, gyri; dark, sulci). Insets show a complete semi‐inflated hemisphere. Despite of some inter‐individual variations, low frequencies tend to be represented in lateral HG and superior temporal cortex, whereas high frequencies tend to occur more medially rostrally and caudally to HG. Note that although individual cortical features are shown in all panels to facilitate comparisons, the volumetric results were actually obtained using a fixed group‐average surface.
