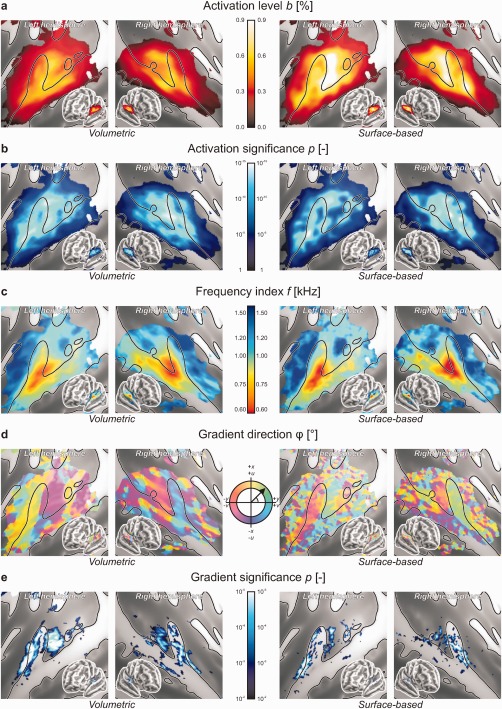
Figure 4.

Group‐level outcomes based on volumetric (left) and surface‐based (right) registration. The results of a supplementary surface‐based analysis with 8‐mm smoothing are shown in Supporting Information Figure 3. (a) The mean activation level b was determined by averaging the responses to all six stimulus frequencies, expressed as a percentage signal change relative to the silent baseline. The strongest responses were found on the caudal side of HG. (b) The group‐level significance of sound‐evoked responses was assessed using conventional mass‐univariate statistics. (c) Frequency tuning as expressed by the frequency index f (converted to kHz) gradually varied across the sound‐activated regions of auditory cortex. Low frequencies were represented laterally on HG and STG, whereas high frequencies were represented medially on the rostral and caudal banks of HG and PT. (d) Tonotopic gradients were determined in appropriate coordinate systems in the axial plane (x, y) for the volumetric analysis or in a plane locally tangent to the sphere (u, v) for the surface‐based analysis, and their direction was displayed by means of a colour‐code. Homogeneous strips of cortex were found to exist, separated by relatively sharp transitions in gradient direction. (e) The group‐level significance of the local tonotopic gradient was tested against the null‐vector using mass‐multivariate statistics. Multiple coherent tonotopic patches could be distinguished.
