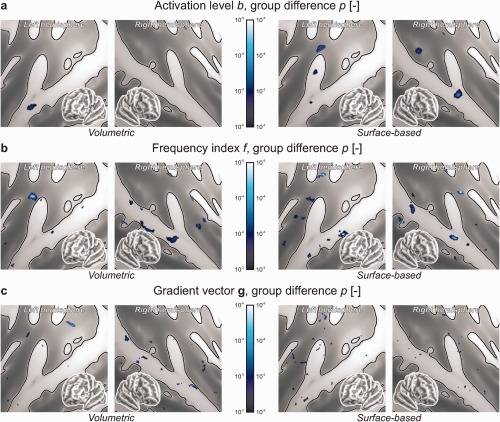
Figure 6.

The results from the normal hearing controls (CON) and tinnitus patients (TIN) were compared and statistically assessed at the group level. Panels show the significance of group differences regarding (a) mean activation levels b, (b) frequency indices f and (c) gradient vectors g. Except for isolated focal effects that were insignificant after correction for family‐wise errors, no differences were observed. (A supplementary surface‐based analysis with 8‐mm smoothing (data not shown) similarly did not reveal any significant effects.) [Color figure can be viewed in the online issue, which is available at http://wileyonlinelibrary.com.]
