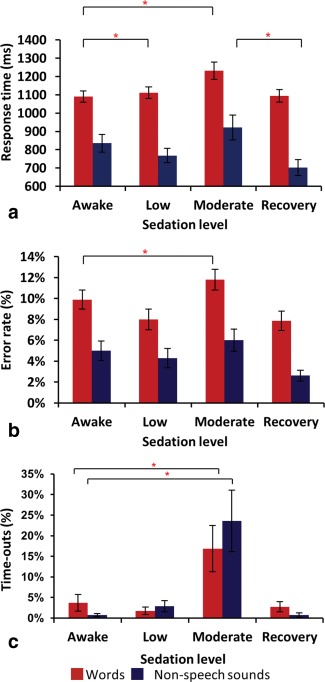
Figure 2.

Behavioral results. (a) RTs vs. sedation level (b) Error rates vs. sedation level and (c) Time‐outs vs. sedation level. * denotes significance at P < 0.05. Error bars show standard error. [Color figure can be viewed in the online issue, which is available at http://wileyonlinelibrary.com.]
