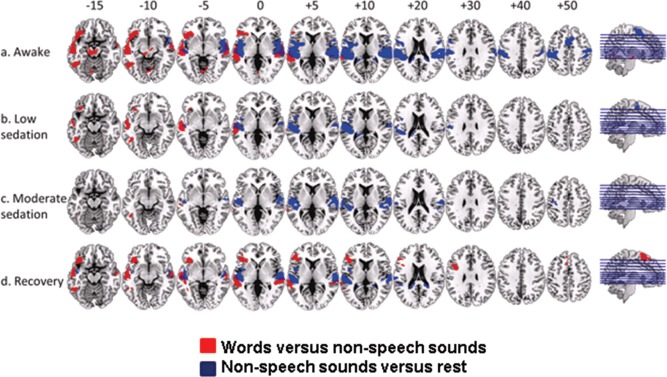
Figure 4.

Group average responses to words vs. nonspeech sounds at awake (a), low (b), and moderate (c) levels of sedation and recovery (d), shown superimposed on a standard T1 weighted structural image. Talairach and Tournoux z coordinates are shown. Red color in the brain slices represents responses to words vs. nonspeech sounds and blue color represents responses to nonspeech sounds vs. rest. We report clusters that survived a voxel threshold of P ≤ 0.001 uncorrected and a random field cluster threshold of P ≤ 0.05 corrected for the entire brain. [Color figure can be viewed in the online issue, which is available at http://wileyonlinelibrary.com.]
