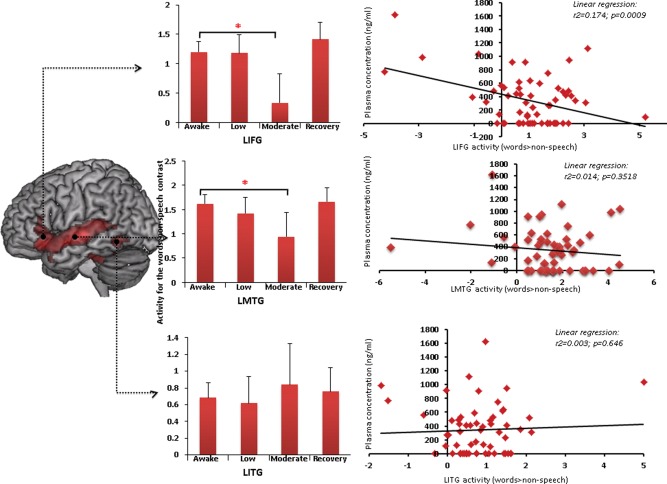
Figure 5.

ROI analyses with MarsBar showing changes in activity in the LIFG (top panel), LMTG (middle panel) and LITG (lower panel) in response to increasing sedation. * denotes significance at P < 0.05. Error bars show standard error. The relationship between changes in activity in the LIFG and plasma propofol concentrations is shown in the correlation plots to the right. Activity in the LIFG negatively correlates with plasma propofol concentration (P = 0.0009). [Color figure can be viewed in the online issue, which is available at http://wileyonlinelibrary.com.]
