
Figure 6.
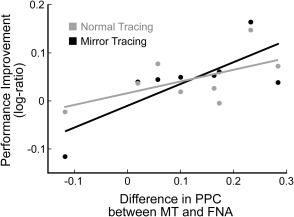
The coupling strength of the PPC during the MT task and post‐MT sleep, relative to the PPC in the FNA control period, correlated with the improvement in performance of the MT task after sleep (r = 0.73, P‐value = 0.04). The figure shows the correlation between coupling strength and the performance improvement separately for the normal tracing period and the mirror tracing period. The values on the x‐axis represent the difference in PPC coefficients between the MT and the FNA conditions while values on the y‐axis indicate the log‐ratio between the distance traced before and after sleep (i.e., a positive value indicates a larger distance traced after sleep). Each dot represents one participant during the normal tracing and the mirror tracing tasks, with the lines of best fit superimposed. While the correlation did not reach significance for the normal tracing period (in gray, r = 0.58, P‐value = 0.13), it was significant for the MT period, which was the more demanding part of the MT task (in black, r = 0.76, P‐value = 0.03).