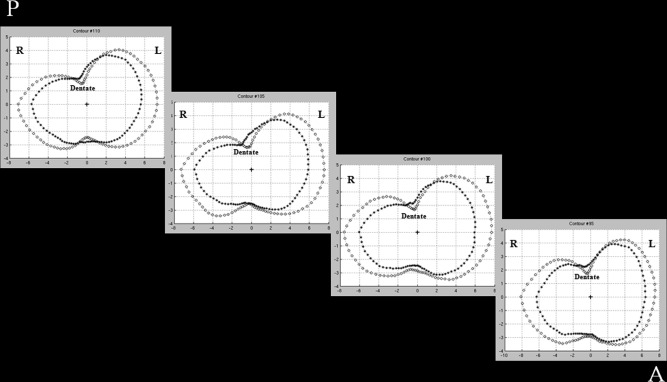
Figure 2.

Plots of average core distance in HC and RRMS. Four sections of the left hippocampus where the average core distance (in mm) is plotted for healthy controls (HC) (circle) and relapsing‐remitting multiple sclerosis (RRMS) patients (asterisk). The position of the medial core is indicated for each section with a cross. L = left, R = right, A = anterior, P = posterior. See text for further details.
