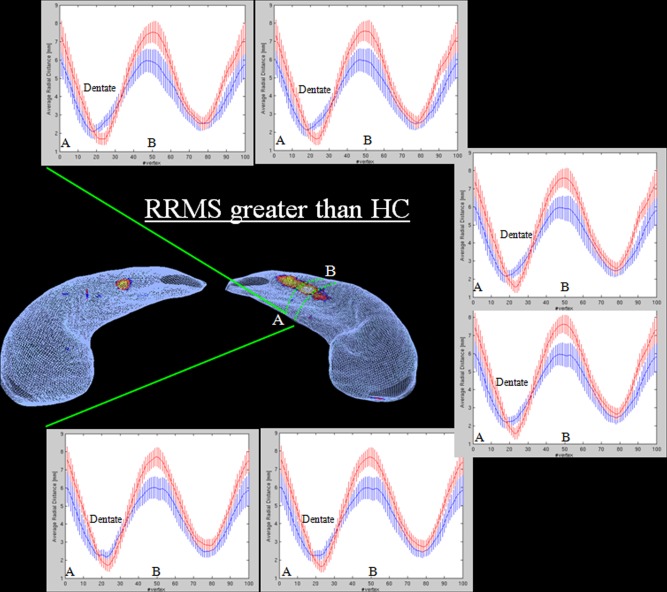
Figure 3.

Radial mapping analysis: HC versus RRMS. Some representative contours extracted from the left hippocampal region included in dashed green lines. Contours were straightened and at each vertex, average and standard deviation of radial distances from relapsing‐remitting multiple sclerosis (RRMS) patients (blue) and healthy controls (HC) (red) were plotted. Letters A and B indicates the innermost and most lateral positions on the hippocampus.
