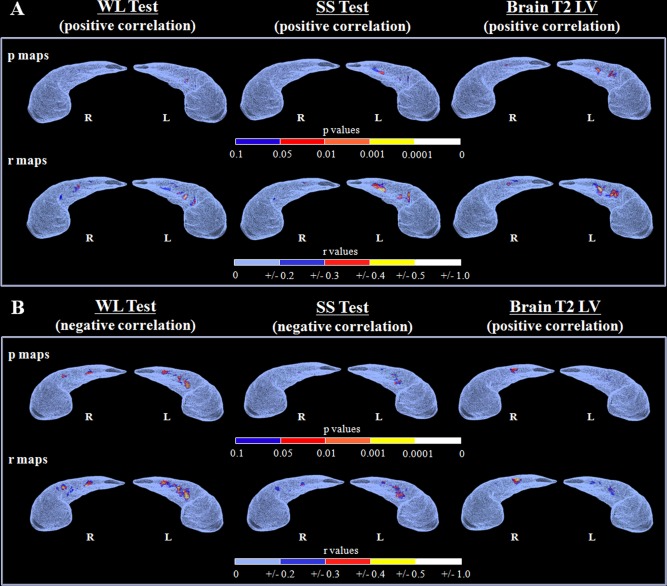
Figure 5.

Radial mapping analysis: correlation analysis. The color‐coded maps show P and r values from the correlation analysis of the dentate gyrus surface (superior aspect) with word learning (WL) test, short story (SS) test and brain T2 lesion load for patients with relapsing remitting (A) and secondary progressive (B) MS. Results are reported for P < 0.05. R = right; L = left.
