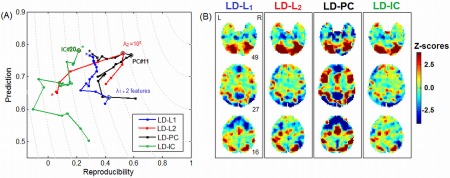
Figure 1.

The impact of regularization choice for a representative subject in the ATvFX contrast, with the linear discriminant (LD) classifier, for a restricted range of 20 regularizer values. (A) Plots showing (P valid = validation prediction, R = reproducibility) curves for regularization via Principal Components (PC), L 1 and L 2 penalties, and Independent Components (IC). Each curve traces out (P valid, R) as a function of degree of regularization. A “*” indicates the point of weakest regularization; PC and IC with 20 components (both ordered by variance), L 1 with nonzero weights on 20 of the linear kernel features (rows of covariance matrix ), L 2 with λ 2 = 10−8. The optimal point that minimizes Euclidean distance from (P valid = 1, R = 1) is circled for each regularizer. (B) The Z‐scored subject SPM produced by each optimized regularizer. [Color figure can be viewed in the online issue, which is available at http://wileyonlinelibrary.com.]
