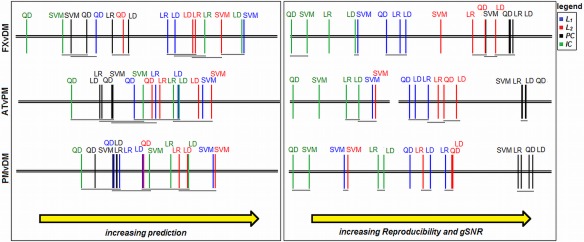
Figure 4.

Critical difference diagrams. Each plot shows average ranking of the 16 different classifier/regularizer models for metrics of Prediction, Reproducibility and gSNR (note that Reproducibility and gSNR have the same rankings, as they are monotonically related; see Resampling, Performance Metrics, and Regularizer Optimization), computed across subjects. All rankings are significant (P < 0.01, Friedman test), and models that are not significantly different are connected by horizontal grey bars (α = 0.05, Nemenyi test). Results are shown for the maximum number of data‐points (N block = 16), for each of the three task contrasts. [Color figure can be viewed in the online issue, which is available at http://wileyonlinelibrary.com.]
