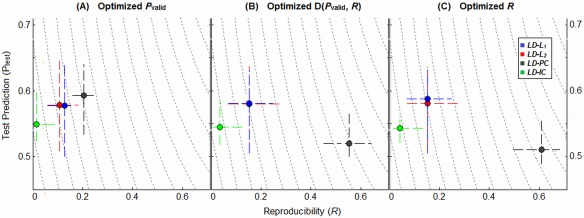
Figure 5.

Plots illustrating the dynamic range of different regularizers in (Prediction, Reproducibility) space, for representative Linear Discriminant (LD) classifier, and the intermediate ATvFX contrast. Points represent the median (P test, R) values for each model, with upper and lower quartile error bars. We show median performance metrics under three different optimization criteria: (A) maximized prediction P valid, (B) minimization of the D(P valid, R) metric which equally weights P and R (this is the metric used for all previous results), and (C) maximized reproducibility R. Results are shown for the maximum sample size (N block = 16). [Color figure can be viewed in the online issue, which is available at http://wileyonlinelibrary.com.]
