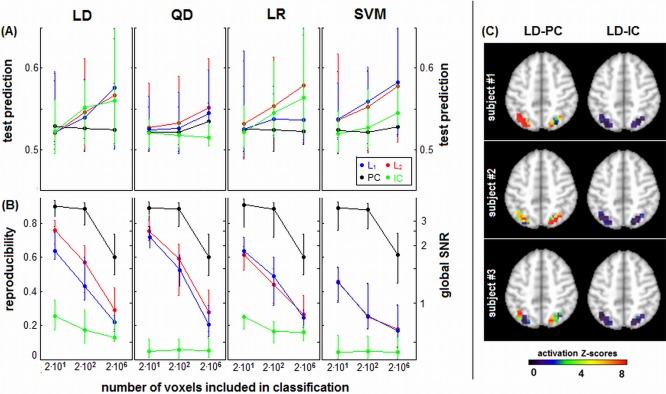
Figure 8.

(A) Prediction accuracy and (B) spatial reproducibility curves as a function of number of voxels, for different regularizer/classifier model combinations. We compared ROI masks of 24 and 276 voxels, against whole‐brain classification (21,535 voxels). Panels represent different classifiers of linear discriminant (LD), quadratic discriminant (QD), logistic regression (LR), and support vector machines (SVM). Each curve represents median prediction across subjects (with interquartile error bars), for a different regularizer. Results are shown for the representative ATvPM contrast, and maximum sample size of N block = 16. (C) Reproducible Z‐scored activation maps for three example subjects, showing results of classification analysis for the 29‐voxel ROI mask of the parietal lobes. Results are shown for LD‐PC and LD‐IC classifiers, which have comparable prediction accuracy but the greatest difference in spatial reproducibility. [Color figure can be viewed in the online issue, which is available at http://wileyonlinelibrary.com.]
