
Figure 1.
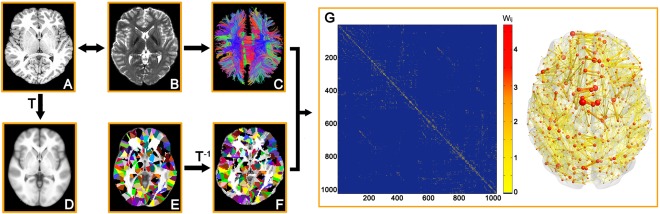
The flowchart of WM network construction by diffusion MRI. (1) The coregistration of a T1‐weighted image (A) to b = 0 image (B) for each subject. (2) The nonlinear registration from the individual T1‐weighted image in DTI space to the ICBM152 T1 template in the MNI space (D), resulting in a nonlinear transformation (T). (3) The application of the inverse transformation (T −1) to the H‐1024 template in the MNI space (E), resulting in subject‐specific parcellation in the DTI native space (F). All registrations were implemented in the SPM8 package. (4) The reconstruction of the whole‐brain WM fibers (C) was performed using deterministic tractography in DTI‐studio. (5) The weighted networks of each subject (G) were created by computing the number of the streamlines that connected each pair of brain regions. The matrix and 3D representation (axial view) of the WM structural network of a representative healthy subject are shown in the right panel. The nodes are located according to their centroid stereotaxic coordinates, and the edges are coded according to their connection weights. The network was visualized using BrainNet Viewer software (http://www.nitrc.org/projects/bnv/). See the Methods and Materials for further details. [Color figure can be viewed in the online issue, which is available at http://wileyonlinelibrary.com]