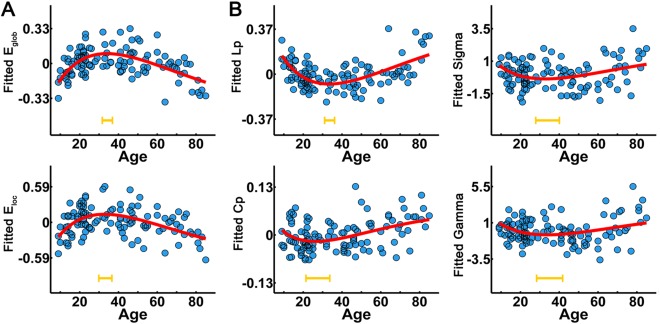
Figure 2.

The lifespan trajectories of the global network metrics of the WM network. (A) The lifespan trajectories of global and local network efficiency. (B) The lifespan trajectories of small‐world properties (L p, C p, gamma, and sigma). The blue dots represent the adjusted values of each subject after controlling for gender and brain size. The curve‐fitted lines are shown in red. The orange bars at the bottom denote the age of peak and its 95% confidence interval. Significant age‐related nonlinear trajectories were found for these global network metrics (all P < 0.05). [Color figure can be viewed in the online issue, which is available at http://wileyonlinelibrary.com.]
