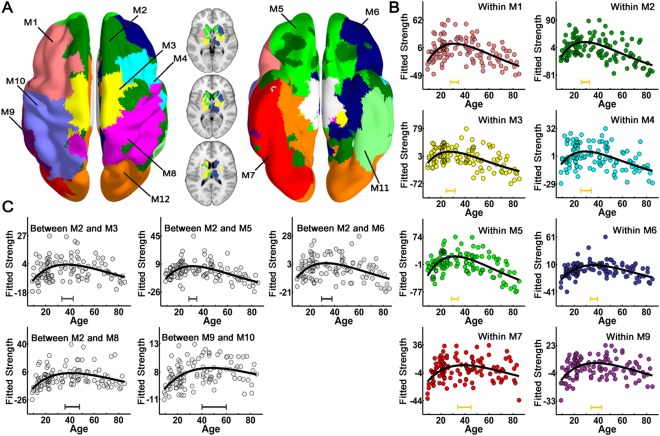
Figure 4.

The modular structure of the group‐averaged WM network and lifespan trajectories of the connection strength of intramodule and intermodules. (A) The left panel is a 3D representation of the group‐based modular structure (axial view) from top to bottom, with the bottom to top representation shown in the right panel. The modular structure of the subcortical regions was showed in the middle, with three axial slices overlaid on the volume template. Twelve modules were identified for the mean WM network and represented by different colors. Significant age‐related nonlinear changes of intramodule and intermodule connections were found and were primarily located in the bilateral prefrontal and temporal cortices (P < 0.05, Bonferroni correction). The dots with different colors corresponding to each module represent the intramodule connection strength (B) and the dots in gray represent intermodule connection strength (C) after controlling for gender and brain size. The curve‐fitted lines are shown in black. The bars at the bottom denote the age of peak and its 95% confidence interval. M1: left dorsal frontal cortex; M2: medial superior frontal cortex; M3: supplementary motor area; M4: right dorsal frontal gyrus; M5: orbital frontal cortex; M6: right inferior frontal and parahippocampal cortex; M7: left temporo‐occipital cortex; M8: right pre‐ and postcentral gyrus; M9: left middle temporal cortex; M10: left pre‐ and postcentral gyrus; M11: the right middle and inferior temporal gyrus; M12: the occipital cortex.
