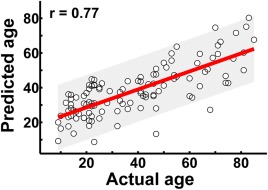
Figure 7.

The prediction of individual age based on the graph metrics of structural connectome. The scatter plot depicts actual versus predicted age bounds of 95% confidential interval. Pearson correlation coefficient between the actual and predicted ages was calculated to assess the prediction accuracy. [Color figure can be viewed in the online issue, which is available at http://wileyonlinelibrary.com.]
