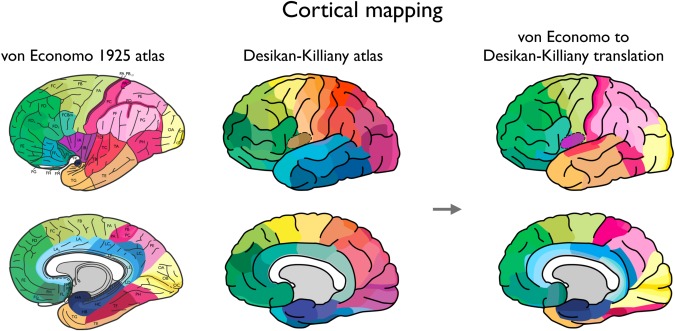
Figure 1.

Cortical mapping. Left panel shows a remake of the original von Economo atlas as published in [Triarhou, 2007c] (reprinted with permission), depicting the cortical areas as described and illustrated in [von Economo, 2009; von Economo, 1927]. The middle panel shows the Desikan–Killiany atlas used for the computation of the MRI‐based thickness of 114 cortical regions (57 per hemisphere, left hemisphere is shown). Right panel shows the regions of the Desikan–Killiany atlas (left hemisphere) as colored by the mapped von Economo regions to our atlas. Supporting Information Table 1 gives a textual description of our mapping of the von Economo regions to the Desikan–Killiany atlas. [Color figure can be viewed in the online issue, which is available at http://wileyonlinelibrary.com.]
