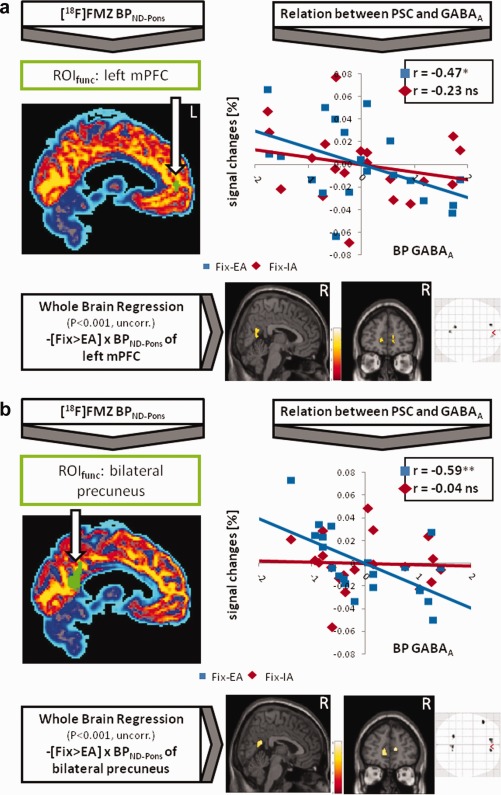
Figure 2.

[18F]FMZ‐PET imaging was used to calculate binding potentials (BPND‐Pons) for GABAA receptors, applying functional regions of deactivation (ROIfunc, green color) derived from the contrast [Fixation > Internal/External Awareness] (P ≤ 0.05, FWE‐corrected, k ≥ 5; see also Fig. 1). These values were correlated (controlled for gray matter) with percent signal changes (PSC) of the ROIs (see partial correlation graph showing the residuals of BPND‐Pons and PSC, *P ≤ 0.05, **P ≤ 0.01). Moreover, BPND‐Pons values were entered into a whole brain regression analysis in SPM (controlled for the proportion of gray matter). The lower part shows a negative correlation for the contrast [Fixation > External Awareness] with BPND‐Pons (P ≤ 0.001, uncorrected, k ≥ 20). (a) Shows results for the left mPFC and (b) for the bilateral precuneus. Results for the right mPFC can be found in Supporting Information Figure 1. Calculations applying BPND‐WM can be found in Supporting Information Figure 3.
