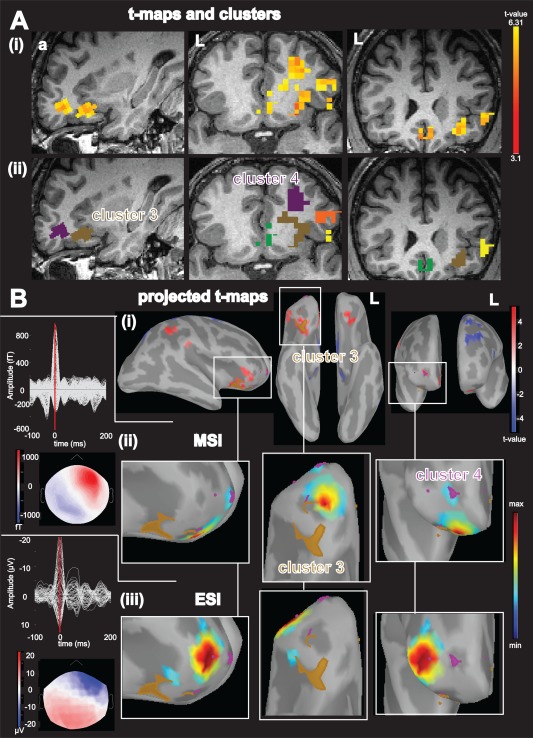
Figure 2.

Concordance of different regional BOLD activations with ESI and MSI at the peak of the averaged IED for patient 5, A: (i): Activations (yellow‐red color code) superimposed over the patient's T1 MRI (from left to right: sagittal view, axial view, coronal view); (ii): result of the BOLD cluster size test presented in the volume space super‐imposed over the individual T1 MRI of the patient. Each color labels a specific cluster considered for the comparison with ESI/MSI: cluster 3: brown, cluster 4: purple; B: (i): Combined BOLD t‐map projected over the cortical surface and represented over the inflated brain using Brainstorm software. Activations results are presented using a red‐white color code and deactivations are presented using blue‐white color code. The projection of activation cluster 3 is highlighted in brown, and the activation cluster 4 is highlighted in purple, red arrow points toward the vertex with highest t value, from left to right: right lateral view, lower view, frontal view; (ii): MSI, left: superimposed MEG signals for the averaged IED and bottom corresponding MEG spatial topography at the peak of the IED (blue: negative, red: positive), right: magnified comparison between BOLD activation cluster 3 and 4 and MSI jet‐color scale (maximum red, thresholded at 70% of the maximum (max. 70%), max. 30% marked on colorbar with white rectangle), same orientation as row above. (iii): superimposed EEG signals for the averaged IED and bottom the corresponding EEG spatial topography at the peak of the EEG IED (blue negative, red positive), right: magnified ESI results, same color code, threshold and orientation as for comparison with MSI. The magnified figures are chosen to better illustrate the regional comparison of ESI and MSI with the BOLD responses, all significant source imaging results are shown. Abbreviations: fT: femto‐tesla, µV: micro volt, L: left, a: anterior MSI finding thresholded at maximum 30% (max. 30%) was concordant (Dmin<5mm, AUC >70%) with cluster number 3 and 4, while the ESI finding was concordant with cluster number 4 only. Please note also the BOLD responses involving areas of both hemispheres. For Figures 2, 3, 4, 5, 6 the MSI and ESI findings are thresholded at max. 70% (not max 30% which was used for the concordance comparison with the BOLD) to further illustrate the extent of the source. [Color figure can be viewed in the online issue, which is available at http://wileyonlinelibrary.com]
