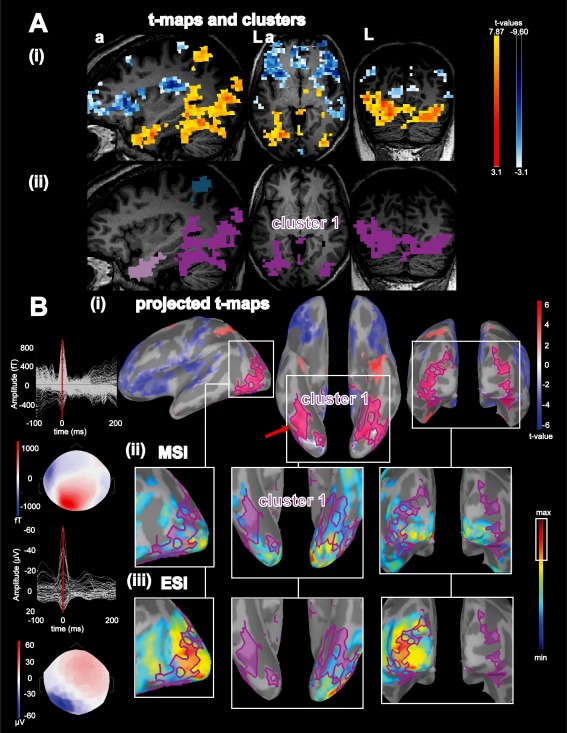
Figure 4.

Concordance of BOLD activation with ESI/MSI for patient 15: A: (i): Activations (yellow‐red colorcode) and deactivations (blue‐white colorcode) superimposed over the patient's T1 MRI, from left to right: sagittal view, axial view, coronal view; (ii): results from the BOLD clusters size test presented in the volume space superimposed over the patient's T1 MRI. Each color labels a specific cluster considered for the comparison with ESI/MSI, activation cluster 1: purple. B: (i): Combined BOLD t‐map projected onto the cortical surface and represented over the inflated brain using Brainstorm software. Activations are presented using a red‐white color code and deactivations are presented using blue‐white color code. The projection of activation cluster 1 was highlighted in purple, red arrow points towards the vertex with highest t value, from left to right: left lateral view, lower view, posterior view; (ii) MSI: left: superimposed signals of MEG interictal discharges (IED) and bottom coresponding spatial topography at the peak of the IED (blue: negative, red: positive), right: magnified comparison between activation cluster 1 and magnetic source imaging (MSI) jet‐colorscale (max red, thresholded at 70% of the max, max. 30% marked on colorbar with white rectangle), same orientation as row above. (iii) ESI left: superimposed averaged signals of EEG IED and bottom the corresponding EEG spatial topography at the peak of the EEG IED (blue negative, red positive), right: magnified ESI results same colorscale, threshold and orientation as for comparison with MSI. abbreviations: fT: femto‐tesla, µV: micro Volt, L: left, a: anterior. ESI and MSI thresholded at max. 30% were concordant with the left hemispheric part of cluster 1 over the left lateral occipital lobe. In addition ESI and MSI were concordant with each other although MSI findings extended to the contralateral hemisphere. For this patient the BOLD clusters extended to deep basal occipital and basal temporal structures. Because these parts were not covered by ESI/MSI this suggests the added value of the BOLD response for deep brain regions. [Color figure can be viewed in the online issue, which is available at http://wileyonlinelibrary.com.]
