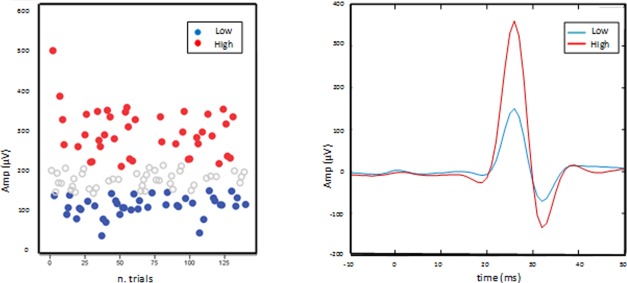
Figure 2.

Procedure to identify high and low motor pathway excitation levels. Left MEP peak‐to‐peak amplitude for each trial of a representative subject, with largest/smallest third (red/blue) of trials used to select the EEG epochs to obtain individual EEGhigh and EEGlow averages. Right average of largest/smallest third (red/blue) MEPs in the [−10, 50] ms time window.
