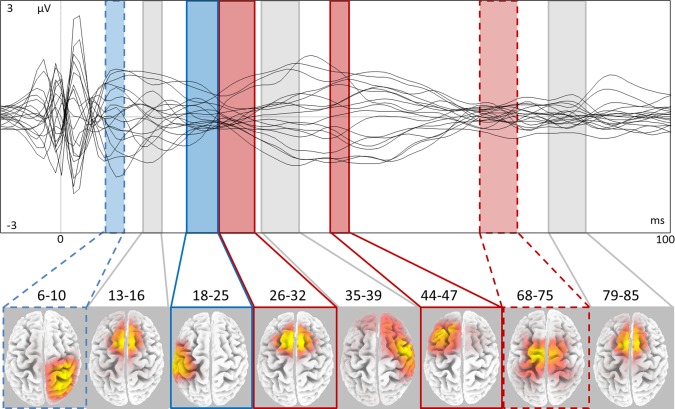
Figure 3.

Cerebral areas recruited differently at low and high CSMP excitation levels by left M1‐TMS. Top superimposition in a butterfly plot of the TMS evoked potentials recorded at electrodes common to all subjects in the [−10, 100] ms time window, obtained from grand average of the differences between high and low CSMP. Bottom region of activation at corresponding latencies (ms), with color code referring to lower/higher (blue/red) activation corresponding to higher/lower CSMP excitation level, trends indicated by dashed lines and significant differences by solid lines.
