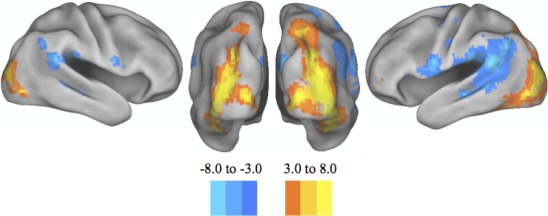
Figure 1.

Group similarities. Posterior and lateral views of the cortical surface rendering of the major areas of increased and decreased BOLD response during the processing of a visual cue. A similar pattern was seen when comparing the entire groups' response to the amalgamation of bistable and monostable images. Namely, there was a significant increase in the BOLD response within the bilateral occipital cortices, along with a decrease in the BOLD response in the bilateral temporoparietal junction. These results were significant after correction for multiple comparisons using a false detection rate of P < 0.05. [Color figure can be viewed in the online issue, which is available at http://wileyonlinelibrary.com.]
