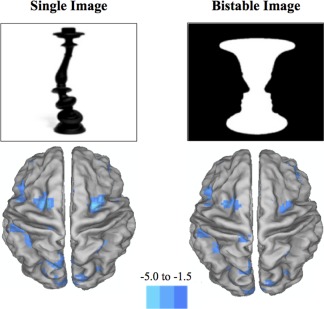
Figure 2.

Differences between two groups. Graphical depictions of the brain representing the main regions of increased BOLD contrast in the comparison of hallucinators against non‐hallucinators (P < 0.001 and clusters = 10). The leftmost image represents the group differences when viewing bistable images and the rightmost image represents the differences when viewing a monostable image. The major differences were found in regions comprising the dorsal attention network, such as the bilateral frontal eye fields, the superior parietal lobule and the MT+ region. The blue color intensity in the image reflects the t‐statistic from the second level random‐effects comparison of hallucinators and non‐hallucinators. [Color figure can be viewed in the online issue, which is available at http://wileyonlinelibrary.com.]
