
Figure 5.
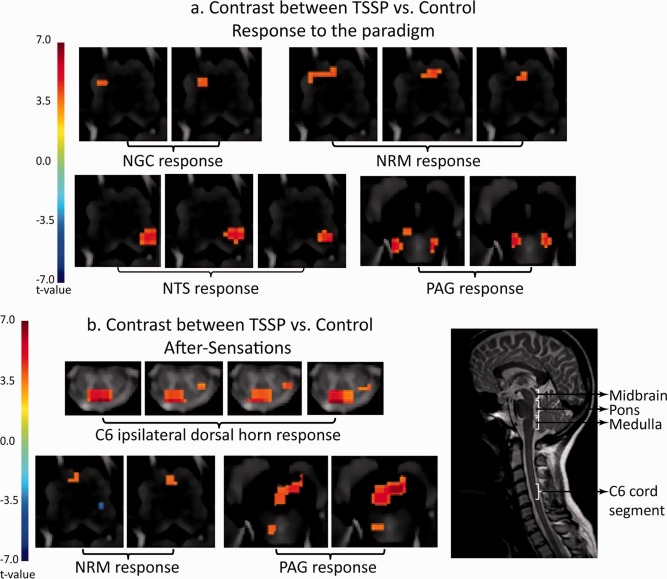
Results of the contrast analysis comparing BOLD signal changes between the TSSP and control conditions. The results are overlaid on high resolution transverse slices. The color scale indicates the significance of areas with different responses between the conditions (t value). A midline sagittal slice (taken from fMRI data) from one participant is shown for reference and illustrates the approximate location of the midbrain, pons, medulla, and C6 cord segment. (a) Key areas with significantly different responses to the stimulation paradigm are demonstrated in the vicinity of the NGC, NRM, and NTS in the medulla, and PAG in the midbrain. (b) Key areas with significantly different responses to the after‐sensations are shown to be the right dorsal horn region of the C6 segment, near the NRM in the medulla, and in the vicinity of the PAG. [Color figure can be viewed in the online issue, which is available at http://wileyonlinelibrary.com.]