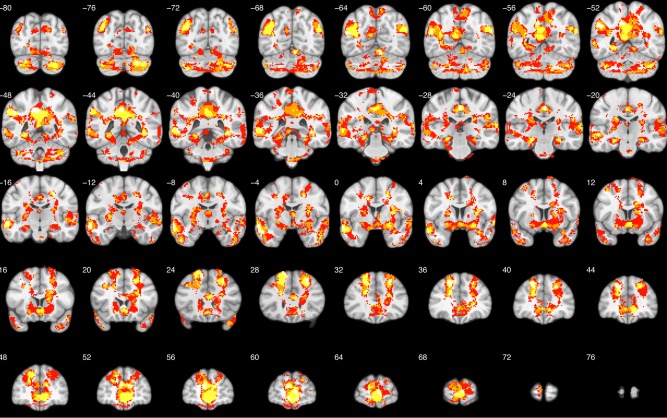
Figure 5.

Conjunction map. Conjunction of all four brain–behavior correlation maps. White indicates spatial overlap for all four maps. Yellow indicates spatial overlap for three of the four maps. Orange indicates spatial overlap for two of the maps and red indicates no spatial overlap. [Color figure can be viewed in the online issue, which is available at http://wileyonlinelibrary.com.]
