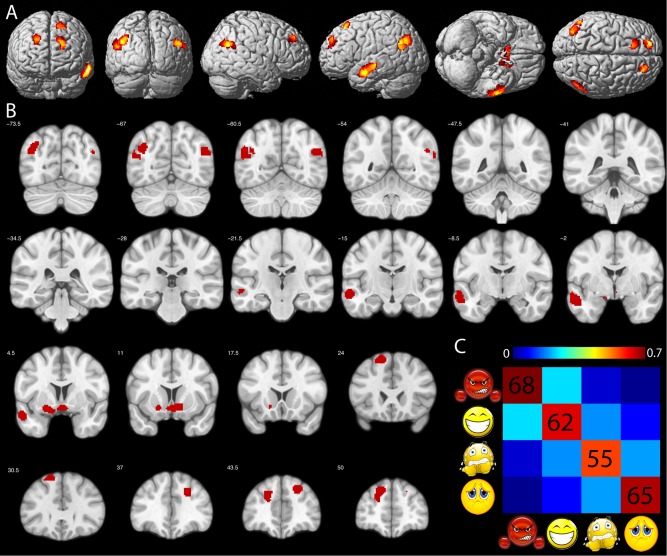
Figure 6.

SVM classification. Colored voxels in (A) and (B) indicate ROIs of the GEN showing significant SVM classification performance. C: Average percent correct classification across the 10 ROIs highlighted in (A) and (B). Chance level = 25%. Order of conditions from left to right and top to bottom: angry, happy, fearful, and sad. [Color figure can be viewed in the online issue, which is available at http://wileyonlinelibrary.com.]
