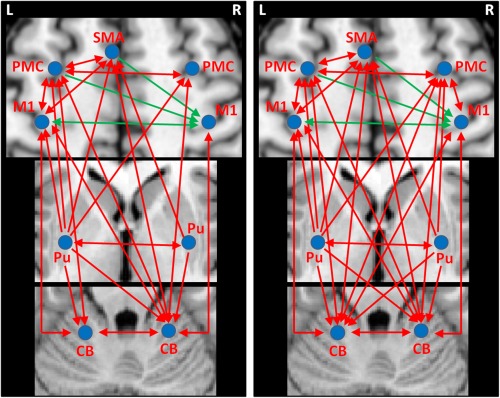
Figure 5.

The effective connections in healthy controls (A) and PD patients (B) during performance of unilateral right hand movement. The results shown are the path coefficients between the ROIs and other regions that are significantly different from zero (two‐sample t‐test, P < 0.001, Table 3). The arrows indicate the direction of connectivity. The red/blue lines indicate positive/negative connectivity, respectively. Abbreviations: L, left; R, right; CB, cerebellum; M1, primary motor cortex; PMC, premotor cortex; Pu, putamen; SMA, supplementary motor area.
