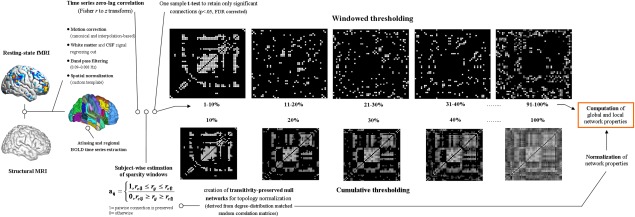
Figure 2.

Preprocessing, thresholding, and graph‐topological properties computation workflow. Schematic representation of the major steps for network topology computation, involving images preprocessing, the thresholding procedure based on the connectivity strength and topology indices computation. From left to right, images underwent canonical preprocessing involving two different approaches for motion correction, removal of possible confounding factor related to breathing and cardiac signals, temporal band‐pass filtering, coregistration, and spatial normalization using the DARTEL module for SPM. Four different atlases (2 functional, 2 anatomical) were used for resting‐state parcellation into regions of interest and consequent BOLD signal time series extraction. A one‐sample t test was applied over resulting connectivity matrices to retain only significant connections, which were used to define several matrices based on connectivity strength and representing strong, intermediate, and weak brain connections (windowed thresholding, upper row). A few matrices obtained at identical sparsity values with the windowed and cumulative thresholding approaches are shown to highlight the different representation of brain connectivity resulting from the procedures. To normalize graph topology indices, an Hirschberger‐Qi‐Steuer algorithm was used to create transitivity preserved null networks based on the random correlation matrices matched for degree‐distribution. Considering our focus on connectivity strength distribution, all previous steps including matrix thresholding were performed at the single subject level. Additional details are provided in Methods. [Color figure can be viewed in the online issue, which is available at http://wileyonlinelibrary.com.]
