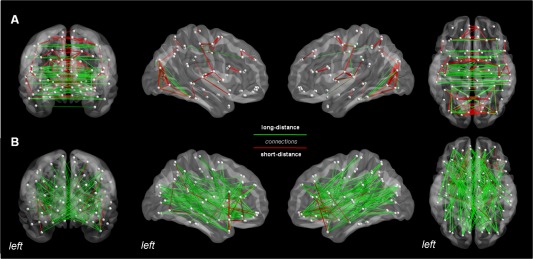
Figure 5.

Topological organization of strong and weak connections. Panel (a) reports the most represented pairwise connections (edges >95th percentile) across all subjects (n = 98) for the Q1 (1–20%, upper row) and the Q4 windows (61–80%, lower row), respectively. Shown from left to right are coronal, right and left sagittal, and axial views. Color‐coding corresponds to short (red, <50 mm) and long (green, >50 mm) connections. As evident from the figure, Q1 showed prevalent interhemispheric, short and long connections, while Q4 long distance, inter‐intrahemispheric balanced projections. [Color figure can be viewed in the online issue, which is available at http://wileyonlinelibrary.com.]
