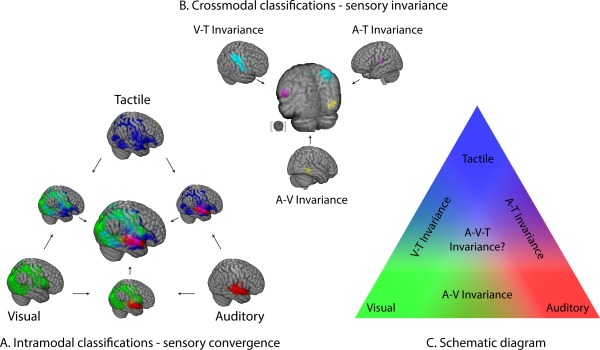
Figure 4.

Overview of results. (A) Intramodal classifications and their overlaps (multimodal convergence). Red, green, and blue voxels indicate successful decoding of auditory, visual, and tactile stimuli, respectively. Arrows indicate the overlay of different maps. Overlapping regions are represented in additive hues. (B) Crossmodal classifications (multimodal invariance). The A–V (yellow), A–T (magenta), and V–T (cyan) invariant regions are a subset of the regions identified by the corresponding intramodal overlaps from A (presented using the same colors). The partially transparent central brain shows the overlay of the three types of invariance, with an inset brain showing the view angle. (C) A schematic view of modal and supramodal information processing. A stepwise convergence of sensory information occurs at border regions of the relevant sensory cortices. [Color figure can be viewed in the online issue, which is available at http://wileyonlinelibrary.com.]
