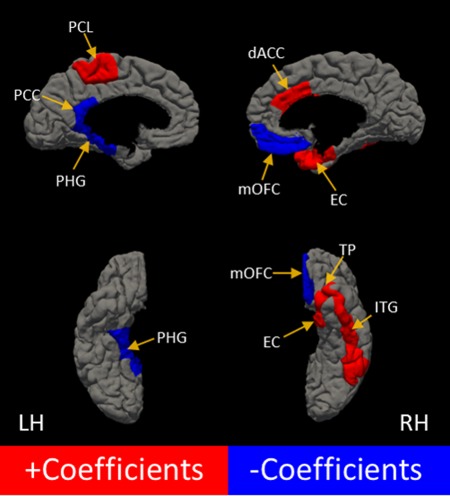
Figure 3.

Features making the most reliable contribution to a generalized full regression model for predicting trait anxiety. Higher trait anxiety was associated with greater connectivity between the amygdala and regions with positive coefficients (in red). Higher trait anxiety was also associated with weaker connectivity between the amygdala and regions with negative coefficients (in blue). Images on the left correspond to the left hemisphere and ipsilateral connections with left amygdala. Images on the right correspond to the right hemisphere and ipsilateral connections with the right amygdala. The estimated weight for each target region implicated can be found in Table I. Regions displayed are: dorsal anterior cingulate cortex (dACC), entorhinal cortex (EC), posterior cingulate cortex (PCC), inferior temporal gyrus (ITG), medial orbitofrontal cortex (mOFC), paracentral lobule (PCL), parahippocampal gyrus (PHG), temporal pole (TP). NB: right caudate is not displayed.
