
Figure 4.
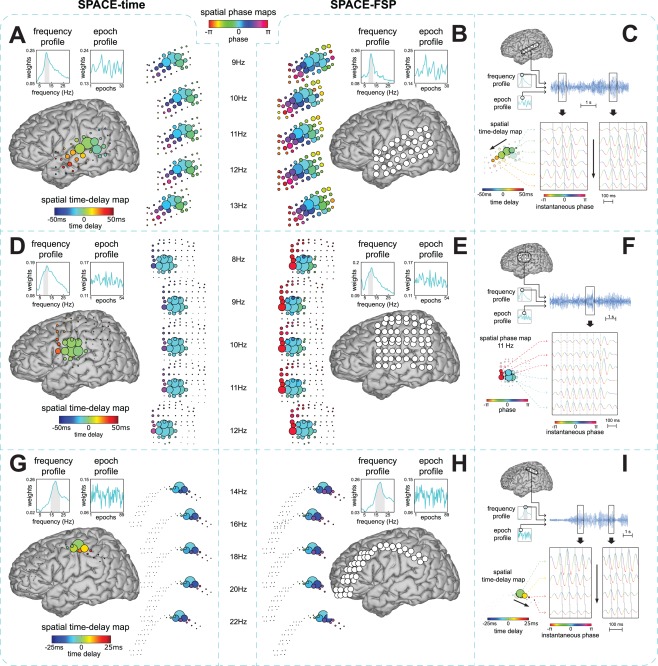
Example phase‐coupled oscillatory networks from human ECoG recordings. We show three‐phase‐coupled oscillatory networks from ECoG recordings during a Sternberg working memory task from three epilepsy patients (see Materials and Methods). Networks are displayed on a Talairach template brain. The first network shows a travelling alpha wave over parieto‐temporal electrodes (A,B,C). The second network shows an alpha network with phase relations dominated by 0 or over fronto‐parietal electrodes (D,E,F). The third network shows a travelling beta wave over parieto‐frontal electrodes (G,H,I). Each dataset was analyzed using the cross‐product formulation of SPACE‐time (A,D,G) and SPACE‐FSP (B,E,F) and the extracted networks were compared (see Materials and Methods). The Fourier coefficients were obtained from Welch‐tapered signals of 2 s, and therefore had a frequency resolution of 0.5 Hz. We also show single trial observations of the networks (C,F,I). Only those grids/strips with high amplitudes in the spatial amplitude map are shown. A: Travelling alpha wave described by the time delay model. Frequency and epoch profiles are shown in the top left. The full grid is shown in the center on a Talairach template. The spatial time‐delay map is shown on the right side. Electrode size reflects the spatial amplitude map. Electrode color reflects the time delay relative to the strongest electrode. The displayed frequencies are selected from the gray band in the frequency profile. Spatial phase maps are shown on the left to compare phases resulting from the time delay model to those of the FSP model. These maps were generated by multiplying each time delay by , where reflects the ‐th frequency. B: Travelling alpha wave corresponding to the one in A described by the FSP model. Frequency and epoch profiles are shown on the top left. The spatial phase maps are displayed in the center. Electrode size reflects the spatial amplitude map. Electrode color reflects the phase relative to the strongest electrode in A. C: Single trial oscillations displaying the travelling alpha wave at the peak frequency (≈11 Hz) in the strongest trial. The top panel displays the selected trial, frequency, and electrodes. The bottom panel shows excerpts from this trial. Instantaneous amplitude is colored by instantaneous phase. The gray solid line reflects the time delay between electrodes. Oscillations matching the time delays cross this gray line at their peaks. Black arrows denote the direction of the travelling wave. D,E: same as A,B but for a dipolar alpha network with 0 or phase relations. F: same as in C but for the dipolar alpha network shown in D and E (≈11 Hz), using the estimates for the FSP model. The dashed gray line is now straight. Oscillations matching the spatial phase maps cross this line at their troughs for the top three electrodes and at their peaks for the bottom three electrodes. G,H: same as A,B but now for a travelling beta wave. I: same as C but now for the travelling beta wave (≈19 Hz) shown in G and H. [Color figure can be viewed in the online issue, which is available at http://wileyonlinelibrary.com.]