Figure 2.

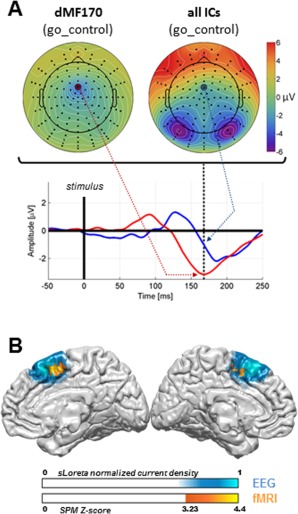
(A) Topographic mapping of dMF170 activity at peak time, back‐projected on the scalp after source separation (upper left side), as compared with topographic mapping of all mixed components before source separation (upper right side). Time‐series of the net activity at C23 are presented for each condition (lower part; red: dMF170; blue: overall activity). The whole topography is strongly influenced by powerful visual activity around 170 ms to the extent that the dMF170 component remains invisible without filtering all interferent sources by means of advanced source separation. (B) Source localization of the dMF170 component with sLoreta. The probability map is presented on the MNI atlas. It extends across the SMC. Combined fMRI results are superimposed. BOLD imaging reveals an overlapping region that is more activated by the stimulus when the situation requires response inhibition (go and nogo conditions pooled together for analysis) than when it does not (go_control condition).
